Delta Neutral Strategy
The Delta Neutral strategy earns funding rate differentials across exchanges without taking directional exposure. It opens a long position on the exchange paying the lowest funding rate and a short position on the exchange paying the highest -capturing the spread between them while net portfolio delta stays at zero.
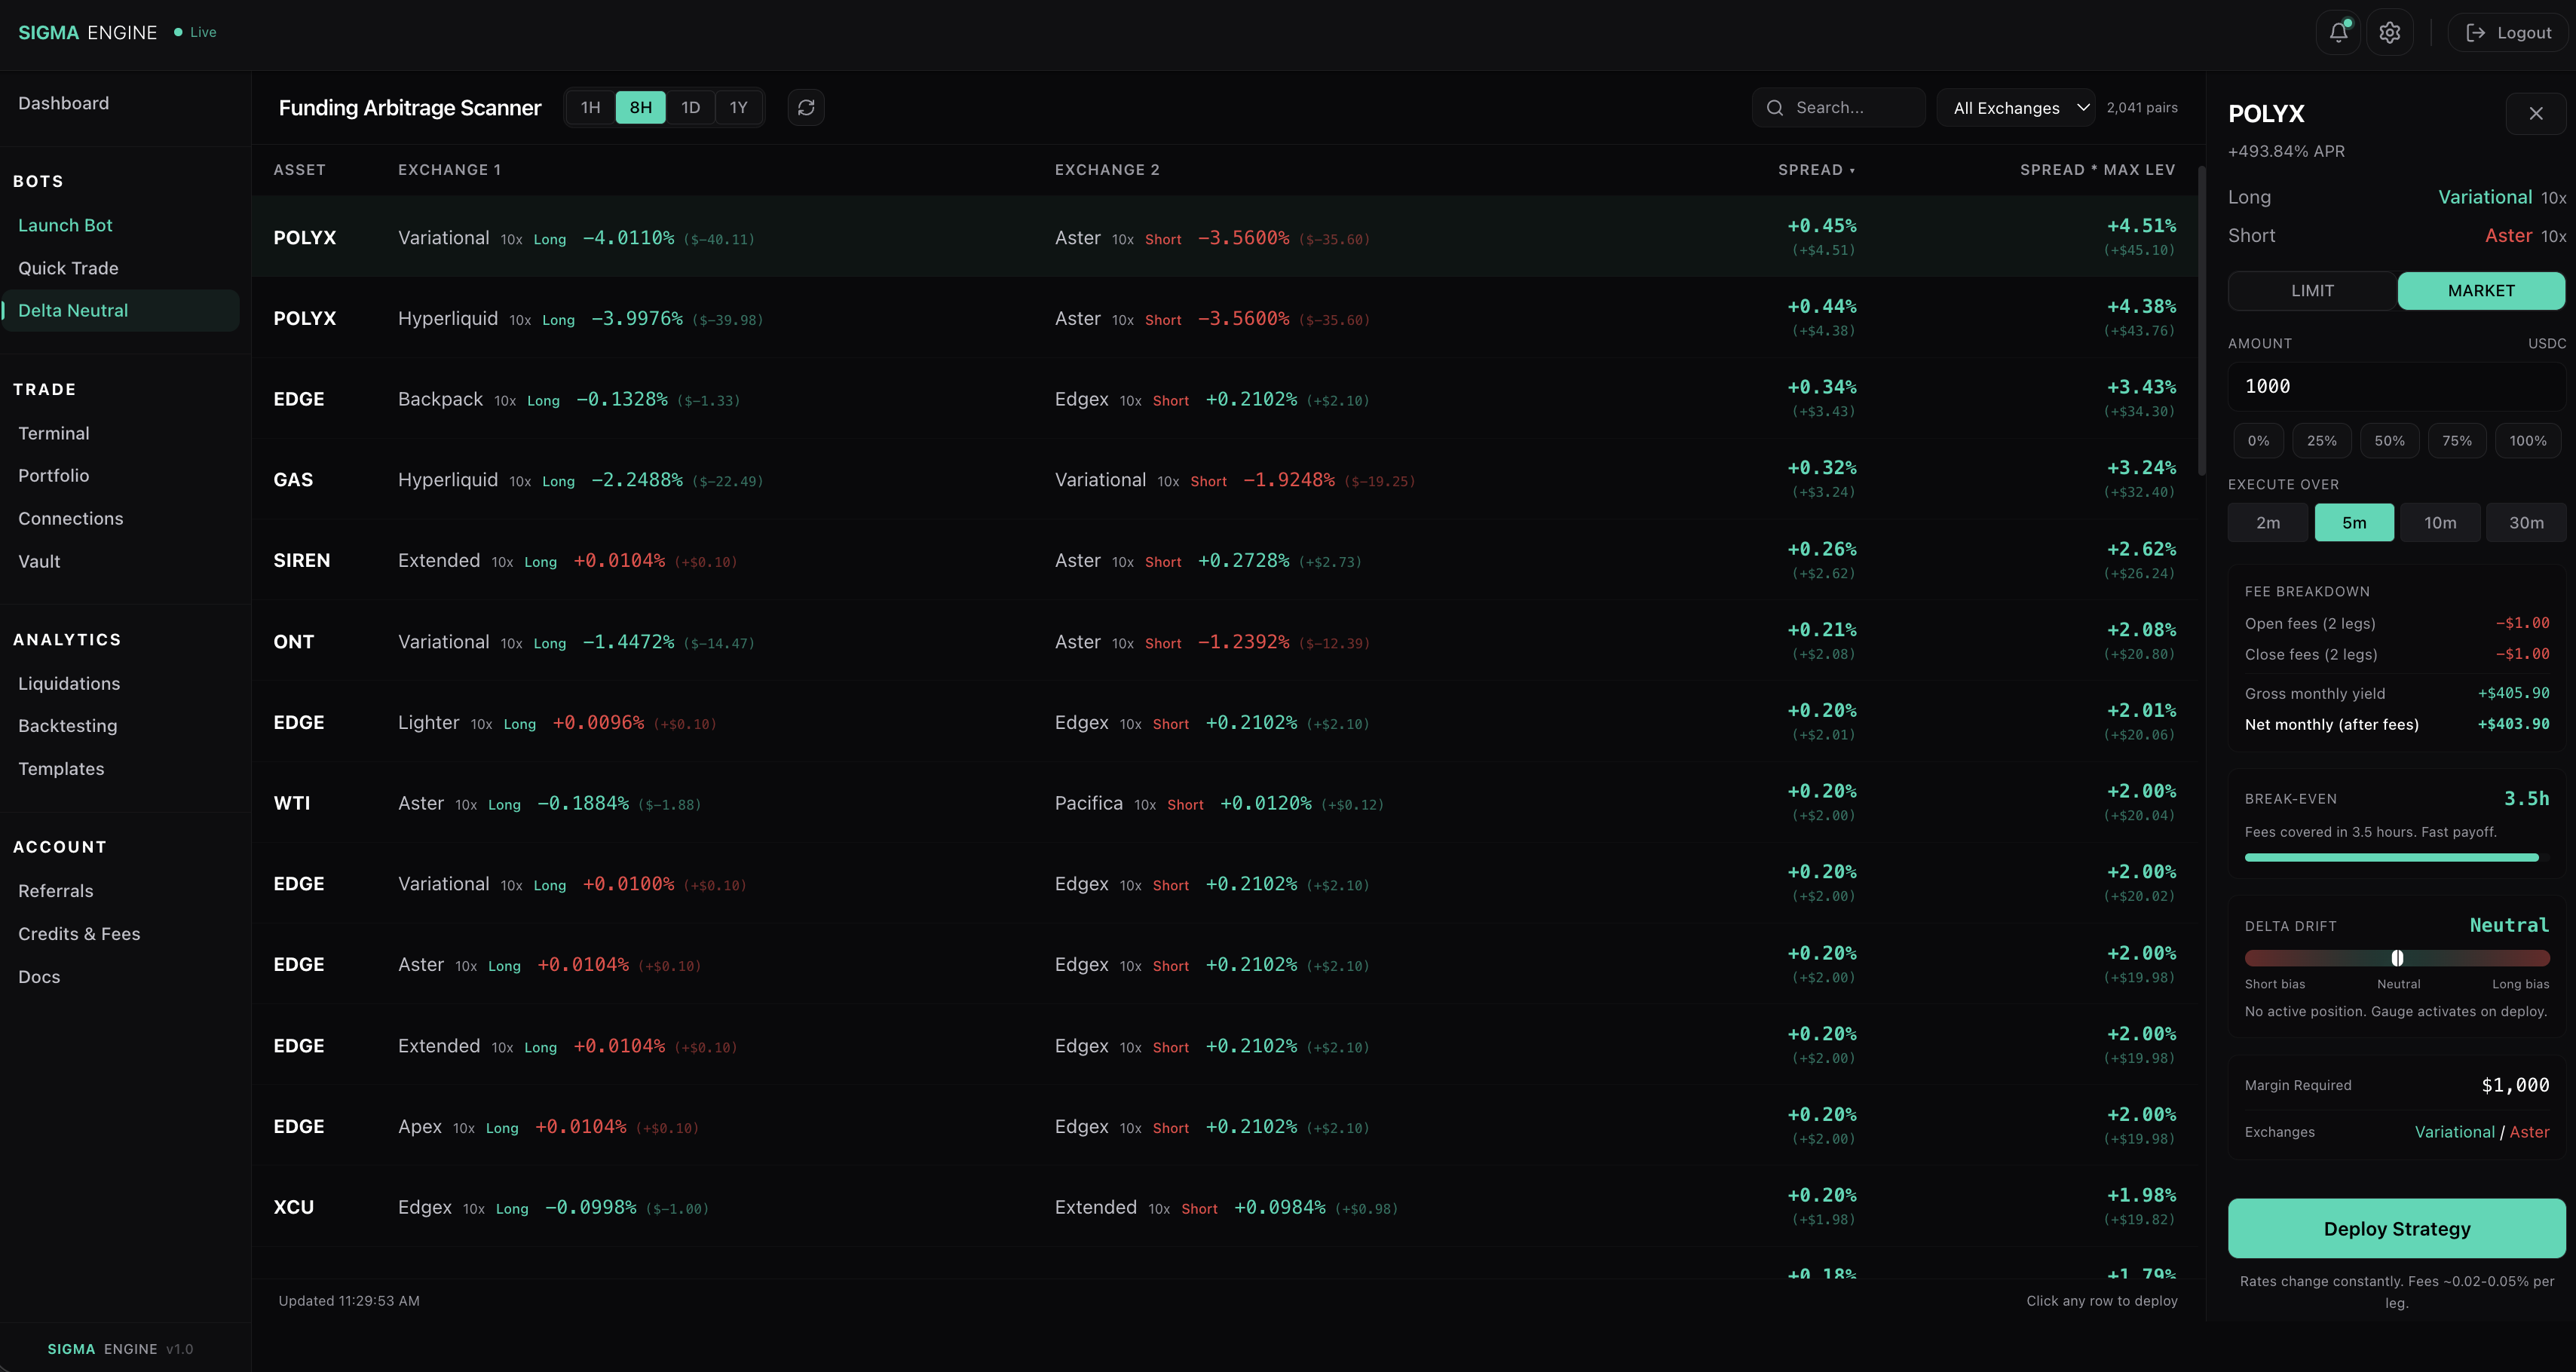
In this example, POLYX has a +0.45% funding spread per 8-hour interval between Variational (long) and Aster (short). Both exchanges are paying shorts -but Variational is paying more (-4.01%) than Aster (-3.56%). By going long on Variational and short on Aster, you collect the 0.45% difference every 8 hours without caring which direction POLYX moves.
With $1,000 deployed at 10x leverage on each side, the scanner projects +$403.90 net monthly yield after $2.00 in round-trip fees, with a 3.5-hour break-even -meaning you recover entry costs after a single funding interval.
How It Works
Perpetual futures contracts charge or pay funding every 1–8 hours depending on the venue. When one exchange is paying -4.01% per interval and another is paying -3.56%, there's a 0.45% spread available with no directional risk -provided you hold both sides simultaneously.
The strategy:
- Scans funding rates across all connected exchanges every 60 seconds -currently tracking 2,000+ pairs
- Ranks opportunities by spread, showing the best long venue and best short venue for each asset
- Enters both legs simultaneously using TWAP execution -long on the low-rate side, short on the high-rate side
- Collects funding on both legs (net positive, since the spread between sides is in your favour)
- Exits both legs simultaneously when the spread compresses below your exit threshold
Reading the Scanner
The scanner table shows every pair where a funding spread exists between two exchanges. Each row is one opportunity:
| Column | Meaning |
|---|---|
| Asset | The perpetual contract (POLYX, EDGE, GAS, etc.) |
| Exchange 1 | The long side -the exchange where funding costs you less (or pays you more) |
| Exchange 2 | The short side -the exchange where funding pays you more |
| Spread | Net funding difference per interval between the two sides |
| Spread x Max Lev | Projected yield at maximum leverage -the headline APR number |
Click any row to open the deploy panel on the right. The panel shows:
- Long/Short venues with leverage
- Order type -Limit (maker, lower fees) or Market (instant fill)
- Amount -USD notional per side
- Execute Over -TWAP duration (2m, 5m, 10m, 30m)
- Fee breakdown -open and close costs for both legs
- Gross/Net monthly yield -projected earnings at the current spread
- Break-even -time until fees are recovered from funding
- Delta Drift gauge -shows whether the position is balanced (neutral) or skewed
Supported Exchanges
The scanner displays funding rates across all venues where rate data is available. You can only deploy positions on exchanges you have connected.
DEXs — Ethereal, Hyperliquid, Extended, 01 Exchange, GRVT, Hibachi, Pacifica, Aftermath, DreamCash, HotStuff, TradeXYZ, Nado
CEXs -Binance, Bybit, Bitunix
Connect exchanges on the Connections page. Each exchange uses a different auth method -some require a wallet signature, others need an API key. No private keys are stored by the platform.
Entry and Exit Flow
Both legs enter and exit via TWAP (Time-Weighted Average Price) execution. The executor splits your total size into smaller chunks placed over time, reducing market impact and improving fill quality.
How TWAP works:
The executor tracks a 2-minute rolling price window. On each chunk:
- Buy orders wait for a drawdown (price dips below the rolling average) before filling
- Sell orders wait for a rip (price rises above the rolling average) before filling
- Intervals between chunks are randomized by ±40% so the pattern isn't detectable
- If a favourable price doesn't appear within 10 minutes, the chunk fills at market
Both legs execute in parallel -the long side and short side fill simultaneously across their respective exchanges.
Entry sequence:
- Click Deploy Strategy on the scanner panel
- TWAP executor slices entry across the chosen duration (default 5 minutes)
- Long leg fills on exchange A, short leg fills on exchange B in parallel
- Position is live and collecting funding once both legs complete
Exit sequence:
- Click Close on an active position, or spread compresses below exit threshold
- TWAP executor unwinds both legs simultaneously (default 5 minutes, faster than entry)
- PnL is calculated from entry and exit VWAPs plus accumulated funding
Crash recovery: TWAP execution state is persisted to disk. If the API restarts mid-entry or mid-exit, execution resumes automatically from where it left off -no manual intervention needed.
Funding Rate Sources
Rates are pulled from two sources in priority order:
- Fundooor (primary) -aggregated DEX and CEX funding rates, 60-second cache, 2,000+ symbols across all major venues
- Loris (fallback) -secondary aggregator used if Fundooor is unavailable
Both use authenticated API access configured via environment variables. Rates are cached for 60 seconds to prevent upstream API spam from multiple browser tabs.
Risk Management
Delta neutral is not risk-free. The primary risks and how the strategy handles them:
Funding rate flips -The spread can reverse (exchange A starts paying more than exchange B). If the spread compresses below 0.05%, the strategy can auto-exit. With a 3.5-hour break-even on a 0.45% spread, you have significant buffer before a flip erodes profits.
Execution slippage -On thin books, entry and exit can slip. TWAP reduces this by splitting into smaller chunks. Maker-only orders on supported venues pay 0% fees. The fee breakdown in the deploy panel shows exact cost before you commit.
Delta drift -Price divergence between exchanges causes the long and short legs to become unequal. The Delta Drift gauge on the dashboard monitors this. If drift exceeds 1%, the position can be rebalanced by adjusting leg sizes.
Exchange risk -One exchange going down while you have an open position leaves you with a one-sided exposure. Diversifying across multiple exchanges and keeping position sizes moderate reduces this risk.
Position Dashboard
The DN dashboard shows:
- All active positions with entry prices, sizes, and venues
- Current funding spread on each pair (updated every 60 seconds)
- Accumulated funding earned vs. entry costs
- TWAP progress during entry and exit
- Delta drift -how far the position has deviated from true neutral due to price divergence or partial fills
Open opportunities (pairs with spreads above your threshold) appear in the scanner. Each shows the long venue, short venue, symbol, current spread, and estimated monthly yield at that spread.