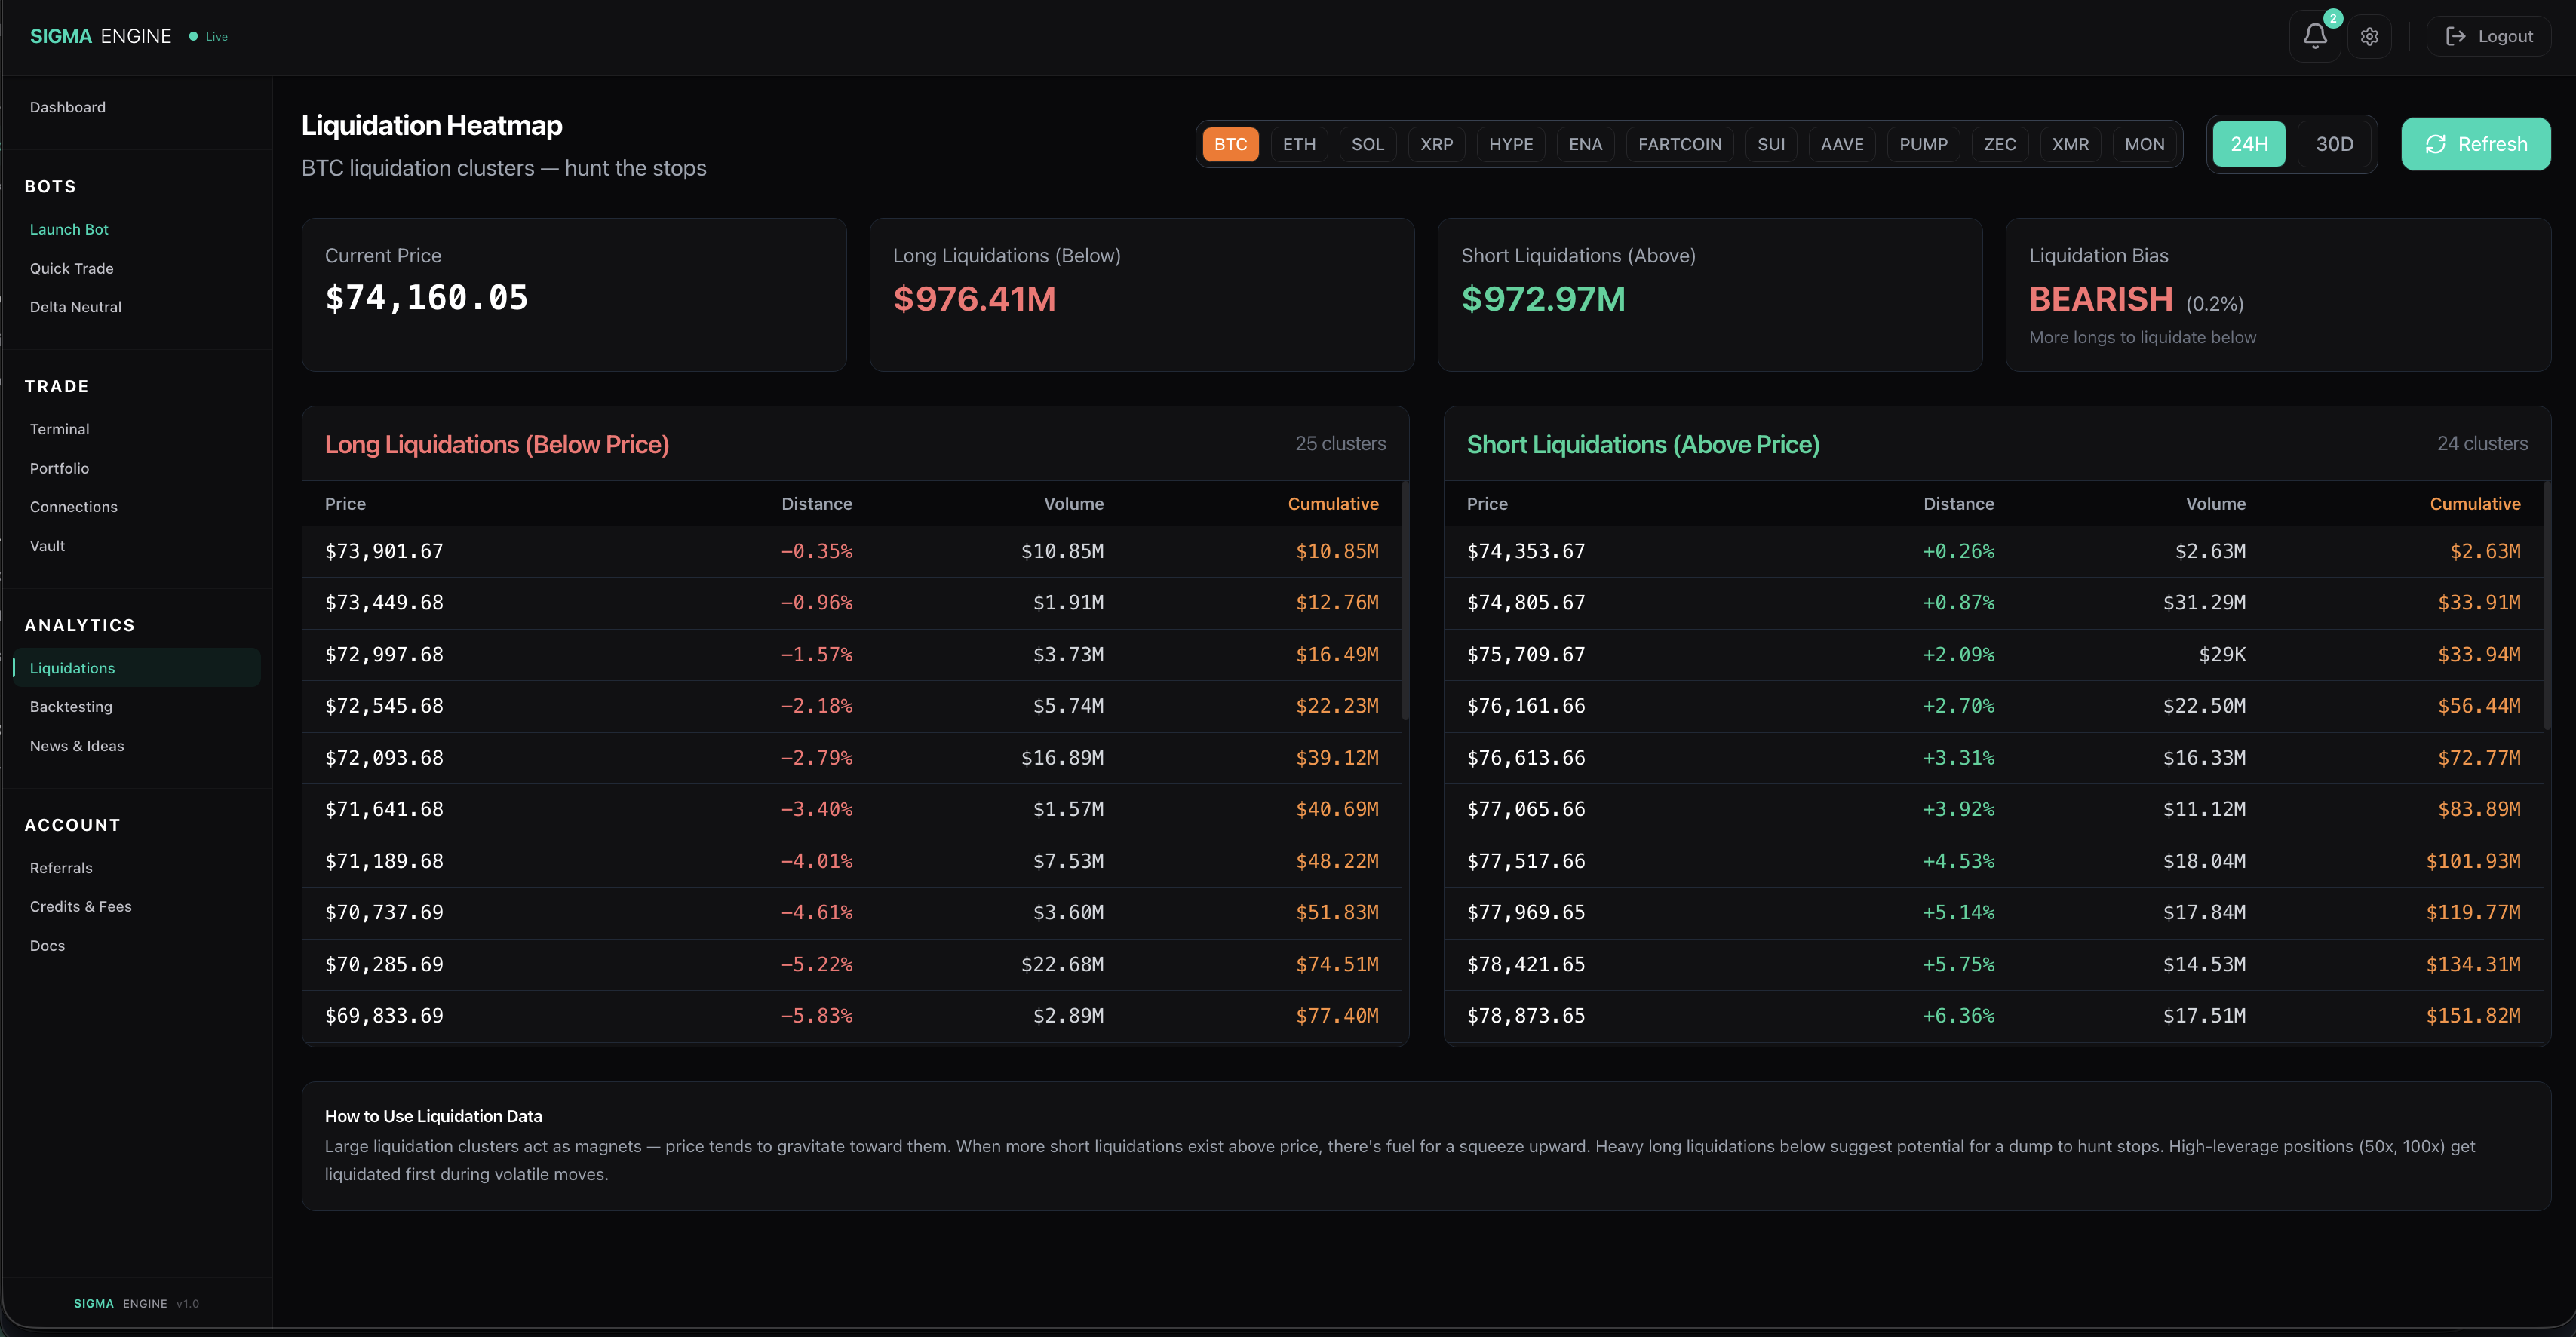
Liquidation Heatmap
The Liquidation Heatmap shows where leveraged positions will be forcibly closed if price reaches those levels. These clusters act as magnets — price tends to gravitate toward the largest pools of liquidations.
What You See
The page is split into two tables:
Long Liquidations (Below Price) — Leveraged long positions that will be liquidated if price drops to these levels. Sorted by distance from current price, closest first.
Short Liquidations (Above Price) — Leveraged short positions that will be liquidated if price rises to these levels. Sorted by distance from current price, closest first.
Each row shows:
| Column | Meaning |
|---|---|
| Price | The price level where liquidations are clustered |
| Distance | How far this level is from current price (percentage) |
| Volume | Dollar volume of liquidations at this specific level |
| Cumulative | Total liquidation volume from current price to this level |
Summary Cards
At the top of the page:
- Current Price — Live price of the selected asset
- Long Liquidations (Below) — Total dollar volume of long liquidations below current price
- Short Liquidations (Above) — Total dollar volume of short liquidations above current price
- Liquidation Bias — BULLISH, BEARISH, or NEUTRAL based on the imbalance between long and short liquidation volume. If there are more shorts to liquidate above, bias is bullish (squeeze fuel). If more longs below, bias is bearish.
How to Use This Data
Liquidation clusters are price magnets. Market makers and large traders know where liquidations sit and will push price toward them to trigger cascading fills and capture liquidity.
- Heavy long liquidations below = potential for a dump to hunt those stops. Price has "gravity" pulling it down toward those clusters.
- Heavy short liquidations above = fuel for a squeeze upward. If price starts rising, those shorts get liquidated (forced buys), which pushes price further up, triggering more liquidations.
- Asymmetric imbalance = directional opportunity. If there's $100M in short liquidations above and only $30M in long liquidations below, the path of least resistance may be upward.
The Signal Engine integrates this data automatically. Bots running with the Proprietary Signal Engine enabled already factor liquidation proximity into their directional bias.
Supported Assets
Use the asset selector at the top to switch between BTC, ETH, SOL, XRP, HYPE, ENA, FARTCOIN, SUI, AAVE, PUMP, ZEC, XMR, MON, and more. Timeframe toggles between 24H and 30D views.
Data updates on demand — click Refresh to pull the latest liquidation levels.